Showing posts with label science. Show all posts

Saturday, September 23, 2023

Global Warming Fact-Checking and Independent Data Analysis/Verification

Introduction

At some point around 2016, I decided to do a small check if Global Warming is real. I made a small program and downloaded weather data from a normal weather website (I think it was http://www.wunderground.com). I only got data for 10 cities around the world and after simple analysis, I found that in some cities temperature goes up and in some cities, it goes down. Before this, I was a Global Warming true believer but after this first data analysis, I started having some doubts.

Research Flow

Starting point

All these years from 2016 until 2023 I was thinking about it and this is what I came up with. Finally, in 2023 I found all the data I needed and I did the proper analysis. As with any research, it is always good to understand what was done by others before me. I asked myself, what should be the most trusted and knowledgeable source of information about Global Warming? The answer is obvious, it is The Intergovernmental Panel on Climate Change (https://www.ipcc.ch/). It is the United Nations organisation, which has all the latest knowledge about this topic. Every few years this organisation produce a report and the latest one in 2023 was the Sixth Assessment Report. There are many different versions of this report, short, full, summary for policymakers, etc. I took the full scientific version which is "The Physical Science Basis"  and available at this link: https://report.ipcc.ch/ar6/wg1/IPCC_AR6_WGI_FullReport.pdf. This report was published in 2021. The previous report is dated 2013.

Raw Data Sources

The report mentioned above has 2409 pages. I have to admit, did not read all of them. I only found relevant pieces. Let's start with page 59 (page 76 by PDF reader) of this report. It is written there, that the temperature increased by 1.09 degrees Celcius from 1850 until 2020. In brackets, there is so so-called confidence interval [0.95 - 1.20]. It means the real temperature increase is somewhere between 0.95 and 1.20 degrees Celcius.


On page 61 (page 78 by PDF reader) there is a graph of the temperature depending on the year.

In this graph, data set names are mentioned. I tried to find all of them and I found that NOAA is easier to get and analyze because it is in CSV format. For example, Berkley Earth has the data only up to 2013 and other has different data format or does not have raw data. By raw data, I mean temperature at a specific point on a specific date. Temperature is recorded by so-called weather stations. This is how the raw data in NOAA data set looks like

AE000041196,20230101,TAVG,207,H,,S,

First is the weather station id, then the data (1 January 2023), and next is the data description. TAVG means average temperature. 207 is the temperature multiplied by 10, so the real temperature is 20.7 degrees Celcius. All this raw data can be found by this link http://www.ncei.noaa.gov/pub/data/ghcn/daily/by_year/ and readme.txt has a detailed description of the fields and their meaning. Also, there is data about each weather station here https://www.ncei.noaa.gov/pub/data/ghcn/daily/ghcnd-stations.txt, which has station position.
I decided to build the same graph as in the previous image by myself based on the raw data, which can be found in the links above.

Data Preparation and Analysis

First, I downloaded all the data from the link above from the year 1750 until 2022. It was 3 billion records. Each year's data comes as a separate file and I merged all of them into a single file. The data contains a lot of different weather parameters such as precipitation, wind, etc. I had to clean up it (delete all non-temperature values) to keep only the temperature. After cleaning around half a billion records left. Then I found that there are some missing data like there is no average temperature for some specific date, but there is minimum and maximum temperature. I restored the average temperature by adding minimum plus maximum temperature and dividing by 2.
I calculated the average temperature per year and put this data into Tableau business intelligence tool so that I could publish nice dashboards here.

Questions about Global Warming

Before I show the results of my analysis, I would like to mention what kind of question I have about Global Warming. Actually, there are only 2 questions: error and coverage. Let me explain it with more detailed information.

Source Data Error

Usually, in physical experiments, all original data comes like this 20.7±0.1, which means the actual value is between 20.6 and 20.8. 0.1 is uncertainty. So, first question, in the raw data here http://www.ncei.noaa.gov/pub/data/ghcn/daily/by_year/ there is no uncertainty. As I find here https://journals.ametsoc.org/view/journals/atot/29/7/jtech-d-11-00103_1.xml (official publication from NOAA) some of the data was provided by volunteers and nobody knows what kind of tools they had and what the uncertainty of this volunteers data is.
In real scientific experiments, any data has to be paired with uncertainty (error). In my university, if I come to a professor with the experimental data like this:

Temperature °C

20.7

21.1

20.5

The professor will reject my work. It must be like this:

Temperature °C

Uncertainty ±°C

20.7

0.1

21.1

0.1

20.5

0.1

If it is not like this, then the data is not scientific. Without uncertainty, it is a school-level experiment.

Data Coverage

This is a very important question because if we do not have enough data points on the map or weather station our data can be meaningless. For example, if there are only 2 points for the whole continent, then there is no point in calculating an average temperature for this continent. It is just not enough data. The good question is how many weather stations are needed to provide good coverage. Sometimes, I drive 10 km from my home to the seashore and the temperature goes down by 2 degrees. I believe the good coverage will be if there is one weather station every 10 km. I will show what is actual coverage in the detailed analysis.
Someone might say, that we have satellite data as well, so why we should rely on the weather stations? I would like to put a link to NASA official website, where they say, that ground weather stations are still more precise than satellites. This is the link https://climate.nasa.gov/faq/49/which-measurement-is-more-accurate-taking-earths-surface-temperature-from-the-ground-or-from-space/.

Not only temperature

All the topics, such as, glaciers melting, and polar bears' problems because polar ice is melting too early in the year are related to the data error and coverage questions. Are there the measurements of the glacier size every 100 meters for the last 50 years in order to tell, that it's size was reduced? Polar bears live on the shore line which is 12000 km long. Are there the measurements available of all these 12000 km at least for every 10 km?

Detailed Analysis

Temperature trend

If I build a graph similar to the graph in the report from The Intergovernmental Panel on Climate Change (temperature per year from 1850 until 2022) I get this graph.


Temperature goes up from 9 to 12 degrees (more than 3 degrees). Even more than in The Intergovernmental Panel on Climate Change report. But let's see what happens if I change the year range. If I put year range 1960-2022, then I get this:
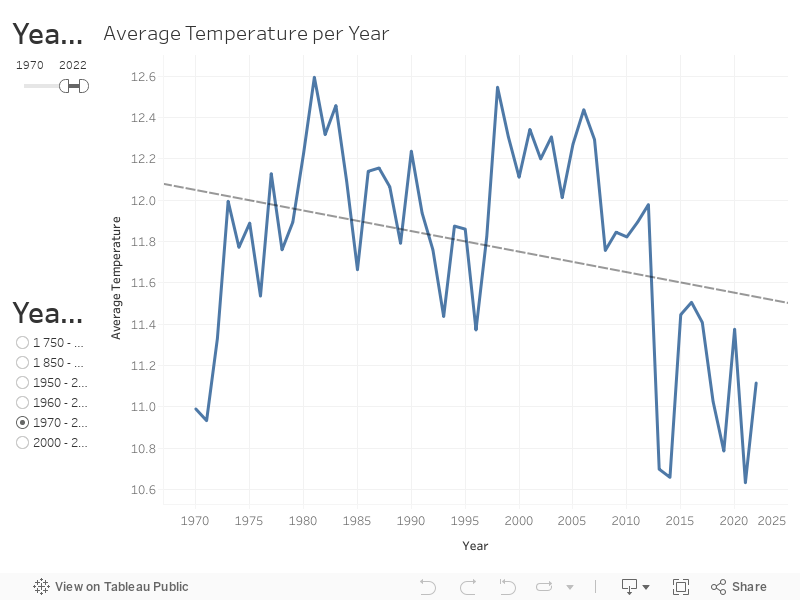
So the temperature increased just a little bit, 0.1 degrees or even less. If I put 1970-2022, then it looks like this:
Temperature goes down by 0.6 degrees! I could not believe it when I first got this result!!! We have global cooling, no Global Warming. The ice age is coming soon!!!
Anyone can play with this data and filter it by the required year by this link on Tableau website or below (embedded dashboard from Tableau website):

Data coverage analysis

As a second stage, I decided to check the coverage or how many weather stations we have and how they are distributed on The Earth. As I mentioned above, I believe that there should be one weather station every 10 km to get good coverage. This is the weather stations coverage for 2022.

Many regions are hardly covered, such as Antarctica, Greenland, North of Canada, Siberia and Africa. Another example, is in the Berkley Earth data set, there is a global average temperature anomaly here https://berkeley-earth-temperature.s3.us-west-1.amazonaws.com/Global/Land_and_Ocean_summary.txt for the year 1850 it is -0.454 degrees Celcius with the uncertainty (error) 0.143 degrees. This looks very precise for the year 1850. Let's see how many weather station was there in 1850. In the Berkley Earth data set only 208 (In NOAA even less - 7 stations). So, 208 weather stations mean the average distance between each station is around 840 km. I can believe that in 1850 there were such precise tools, which could measure temperature with 0.1 degree precision. There was already very complex steam locomotive and other machines. However, it is difficult to believe, that having one weather station every 840 km, we can calculate an average with 0.143 degrees precision.
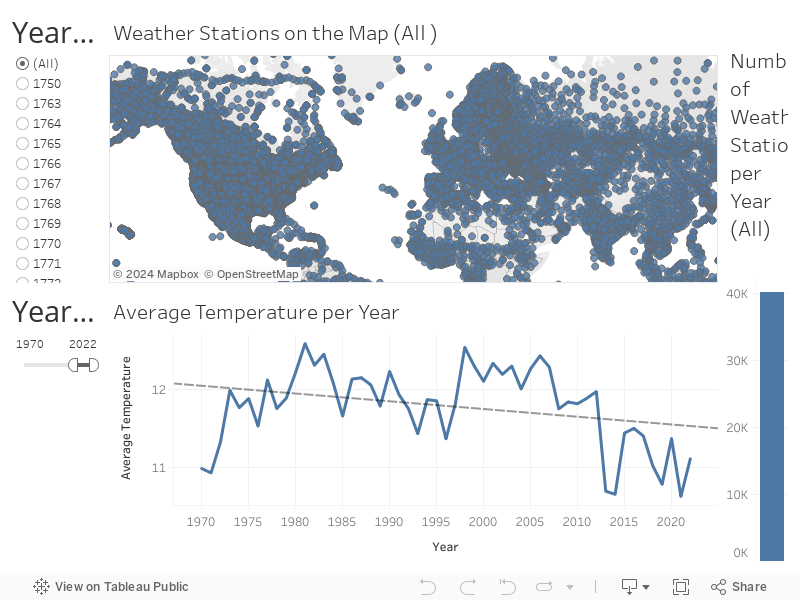
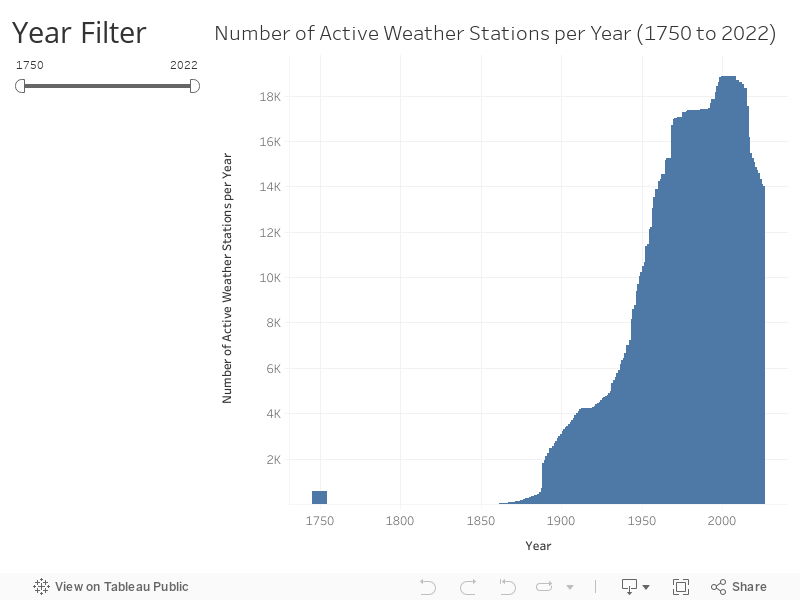
Even with the maximum number of active weather stations, which was about 20000, it means the average distance between stations is 80 km. It is far from ideal coverage 10 km between 2 closest stations.
I made an interactive dashboard with a map where anyone can play with the number of weather stations and temperature trends for a specific weather station or country/region. It is available by this link on Tableau website or below (embedded dashboard from Tableau website):
In addition, I made a dashboard with the number of active weather stations per year and it is available by this link or below:

Conclusion and Open Questions

I am not saying that Global Warming does not exist. Maybe this simple average is not good enough. I did not take into account sea temperature data. It was more difficult to find.
What I am saying is that there are some reasonable doubts and a lot of questions about Global Warming. In other words, there is not enough evidence to say, that Global Warming exists with probability 95%. In some countries like The Netherlands, people are paying CO2 taxes. Is there enough evidence to force all the people to pay CO2 tax?

These open questions are still actual:
  • What is the precision of the original raw data? It is not mentioned in the data source or related works. In other words, what is the precision of tools in each weather station?
  • Coverage is too low. Even during the last 50 years, when there are 15000-20000 weather stations, the coverage is only about 1.4% (under assumption that for good coverage it should be 1 weather station every 10 km).

Update 2024

Recently, I found that International Court of Justice opened the case number 187 about Global Warming and information is available by this link. The case is called "Obligations of States in respect of Climate Change". It will be good if International Court of Justice answers first the questions: "What is the probability if Global Warming exist?" and "Is this probability high enough to force people to pay taxes and force countries to have any legal obligations?". I hope some countries, participating in this case will find this post and based on the data analysis here, they will ask ICJ these questions :). Everyone can always contact me and I can explain it in the details.

Wednesday, May 22, 2019

Extremely simple solution for 2x2 Rubik's Cube - just one algorithm

Introduction

It is not fake. It really works!
 
Recently I tried to solve Rubik's Cube by myself and I found it very complicated. After 30 minutes I could not solve it and I found beginner's solution on the internet like this or this. It is very complicated for a normal person and it is almost not possible to remember it. Why this solution so complicated? Why I need to remember a lot of algorithms? Hopefully, there are some automatic solution finders on the internet :)

I decided to find my own solution, but it should be very simple, that everyone can repeat it and remember. Of course, I read about God and Devil algorithms and that nobody could find a very simple solution so far. But really, for 2x2 Rubik's cube, they offer the solution from 3 steps and you need to memorize at least 8 algorithms. For 3x3 Rubik's Cube, beginner's solution has 7 steps and 9 algorithms have to be memorized. Who can remember this? Only some real geeks or nerds.

Note: Please do not expect to use the solution mentioned in this post for very fast solving/speedcubing. It will not work. This solution is simple but relatively long. It was designed to solve Rubik's Cube with simple and easy to remember algorithm without time limitation.

What is needed to apply this simple solution?

In a few weeks, I found a simple algorithm, which can solve any 2x2 Rubik's Cube. I called it Russian Flag Solution or Z-Solution. Only 2 things have to be memorized, in order to solve it.

1. How to solve one face properly, as shown in the picture below. If you have difficulties to make one face, please watch this video.
It is one state of the cube shown from different sides.

It is one state of the cube shown from different sides.
2. This Color Sequence: White, Blue, Red, Yellow, Green, Orange.


Optionally it is good to remember which color is opposite to which, like White-Yellow, Blue-Green, Red-Orange, but it is not necessary. It will just make it a little bit faster.

This color sequence is easier to remember because the first 3 colors make Russian Flag and the rest are the colors opposite to Russian Flag colors.

What is the trick?

The good question is: how this color sequence and making one face can help?
The whole trick is to make one face properly, white first, then forget about it and make the next one (blue). Then just continue making one face after another in the sequence mentioned above. Of course, while making a blue face, white will be broken, but this is the nice thing about this solution, that there is no need to care about the previous state. Just stupidly make one face after another and that it. No need to think at all. This is demonstrated in the pictures below:


Iteration 1.

Iteration 2.
 

Iteration 3.

Iteration 4.

Iteration 5.

 Iteration 6.
 

and after orange color (Iteration 6) everything should be repeated again from white color (Iteration 1).
This video shows the whole process.


Most probably other sequences will work as well (most probably opposite direction like Orange, Green, Yellow, Red, Blue, White), but for me, Russian Flag is easier to remember and I did not try other sequences. This color sequence is chosen because these are colors in one of the corners if I go through them clockwise. I believe any other color sequence will work if they are from the corner and make a clockwise or counterclockwise sequence.


How much time will it take?

Another interesting question, how much time it will take? Maybe it will take years to go through all possible combinations?
Actually, I did it many times for 2x2 Rubik's cube and I always manage to solve it in maximum 10 minutes. The best time was 30 seconds. In the video above I manage to solve it in 5 minutes. And in terms of how many times it is required to make different faces, I can tell that from my statistics after 10 to 30 iterations it will be solved.

Why does it work?

Do not ask me why it works, I have no clue :) I found this solution accidentally, by just playing with 2x2 Rubik's cube with the thoughts "Let's do one face after another and see what will happen". The only explanation I have is about entropy reduction. Every step I decrease entropy a little bit and in the end, it leads to full order and zero entropy.

Does it work for 3x3 Rubik's cube and other cubes?

The answer is Yes and No. I tried to apply the same algorithm for the 3x3 cube, and sometimes it works, but sometimes not. In the worse case, I made 300 faces (iterations) and could not solve it. It was almost done, just a few parts were in the wrong place, but it did not work. Sometimes, maybe 50% of cases when I was lucky it worked. Read my another post how to solve 3x3 cube with Russian Flag Solution, where I modified a little bit this solution an it always works for 3x3 cube. It has 2 steps for 3x3 cube instead of 1 steps for 2x2 cube.

It works fine for Pyraminx puzzle (Pyramide or mathematically correctly tetrahedron). Just by solving vertical faces in clockwise order first and then bottom face. It becomes solved after a just a few solved faces (3-5), which is very quickly.


It works for this one as well.


I spent some time and make another similar solution for the 3x3 cube with the same color sequence but 2 steps, instead of 1. But it is a different story and I described it in my next post.

Sunday, May 19, 2019

Extremely simple solution for 3x3 Rubik's Cube - just two steps

Introduction

It is not fake. It really works!

Recently I tried to solve Rubik's Cube by myself and I found it very complicated. After 30 minutes I could not solve it and I found beginner's solution on the internet like this. It is very complicated for a normal person and it is almost not possible to remember it. Why this solution so complicated? Why do I need to remember a lot of algorithms? Hopefully, there are some automatic solution finders on the internet :)

I decided to find my own solution, but it should be very simple, that everyone can repeat it and remember. Of course, I read about God and Devil algorithms and that nobody could find a very simple solution so far. But really, 3x3 Rubik's Cube beginner's solution has 7 steps and 9 algorithms which have to be memorized. Some of the algorithms look like this R U R' U R U2 R' U (8 moves of the cube). Who can remember this? Only some real geeks or nerds.

Note: Please do not expect to use the solution mentioned in this post for very fast solving/speedcubing. It will not work. This solution is simple but relatively long. It was designed to solve Rubik's Cube with simple and easy to remember algorithm without time limitation.

What is needed to apply this simple solution?

After I found a simple solution for 2x2 Cube like explained here, I started working on a simple solution for 3x3 Rubik's Cube. Unfortunately, the same solution as for 2x2 cube does not work in some cases, sometimes I manage to solve 3x3 by the same solution as 2x2, but not always. In a 1 month, I finally found a simple algorithm, which can solve any 3x3 Rubik's Cube. I called it Russian Flag Solution or Z-Solution. It consists of 2 steps and only 2 things have to be memorized, in order to solve it.

What has to be remembered?

1. How to solve one face properly.

2. This Color Sequence: White, Blue, Red, Yellow, Green, Orange. (let's call it "Russian Flag Sequence").


Optionally it is good to remember which color is opposite to which, like White-Yellow, Blue-Green, Red-Orange, but it is not necessary. It will just make it a little bit faster.

"Russian Flag Sequence" is easier to remember because the first 3 colors make Russian Flag and the rest are the colors opposite to Russian Flag colors.

What are the steps (brief description)?

Step 1. Solve all the corners and middles.
Solve corners and middles only on one face in the order defined by "Russian Flag Sequence" and after some time all the corners and middles will be solved by themselves. Of course, after solving corners in one face, the previous face will be broken, but it is expected, in the end, all corners will be fine. To solve corners in one face, the same algorithm "how to solve one face properly" (explained in this video) can be used. It is even easier to solve only corners and just skip what is in between the corners. Detailed description.


Step 2. "Around the White".
Solve only one face which is close to white, then solve next face close to white in clockwise or counterclockwise order. This is why I call it "Around the White" algorithm. But do not break the corners. Usually, it is very easy. In other words, it is making faces one by one following the color sequence Blue, Orange, Green, Red or opposite.


After some time full cube will be solved. Detailed description.

Note: Solved corners and middles state is very stable and robust structure, it is very difficult to break it.

Detailed explanation.

How to solve one face properly.

First, I want to put some pictures and explain what does it mean "How to solve one face properly". It should look like shown in the pictures below. If there are some difficulties to solve cube to this state, this video can help.

It is one state of the cube shown from different sides.

It is one state of the cube shown from different sides.


How to solve all corners with the detailed illustrations (Step 1).

Here as I mentioned above the Russian Flag algorithm will help. Only corners on one face have to be solved in a specific order. And again, it has to be solved properly. Below are the pictures showing what is "properly solved corners for one face" and what is "wrong".

It is one state of the cube shown from different sides.

It is one state of the cube shown from different sides.
To achieve this, the same algorithm as to making one face can be followed. And again, if there are some difficulties to make this cube state, this video can be helpful.

Now corners have to be solved in the "Russian Flag Sequence" like shown in the pictures below.

Iteration 1 (white corners).

 Iteration 2 (blue corners).

 Iteration 3 (red corners).

 Iteration 4 (yellow corners).

Iteration 5 (green corners).

 Iteration 6 (orange corners).
and after orange color (Iteration 6) everything should be repeated again from white color (Iteration 1). Of course, if white corners are solved, while solving blue corners white will be broken, but it is ok. And after some time all the corners will be solved automatically.


Most probably other sequences will work as well (most probably opposite direction like Orange, Green, Yellow, Red, Blue, White), but for me, Russian Flag is easier to remember and I did not try other sequences. This color sequence is chosen because these are colors in one of the corners if I go through them clockwise. I believe any other color sequence will work if they are from the corner and make a clockwise or counterclockwise sequence.


How to solve faces "Around the White" with the detailed illustrations (Step 2).

Now one full face has to be solved which is attached to a white and then next face attached to white in counterclockwise order. It is shown in the pictures below. And again while solving one face, previous will be broken, but it is ok. Also after each face, it has to be checked, that corners are not broken. If corners become broken, everything should be restarted from the beginning.

Iteration 1 (blue face).


Iteration 2 (orange face).

Iteration 3 (green face).

Iteration 4 (red face).

and after red color (Iteration 4) everything should be repeated again from blue color (Iteration 1).
This video shows the whole process.

How much time will it take?

Interesting question, how much time it will take? Maybe it will take years to go through all possible combinations?
Actually, I did it many times for 3x3 Rubik's cube and it takes from 5 to 20 minutes. It is approximately the same time for Step 1 (all corners) and for Step 2 "Around the White". For example, 5 minutes for Step 1 and 5 minutes for Step 2. In terms of how many times it is required to make different faces, I can tell that from my statistics after 10 to 30 iterations corners will be solved and similar for step 2 "Around the White".

Why does it work?

Do not ask me why it works, I have no clue :) I found this solution accidentally, by just playing with 2x2 Rubik's cube with the thoughts "Let's do one face after another and see what will happen". And after this, I made a similar solution for 3x3 cube.
The only explanation I have is about entropy reduction. Every step I decrease entropy a little bit and in the end, it leads to full order and zero entropy. Maybe it will lead to some new development in the Group Theory or even Solid-state Physics.

Does it work for other Rubik's cubes?

So far (based on 19 May 2019) I could not manage to find a similar algorithm for the 4x4 cube. All corners algorithm works fine for the 4x4 cube, but step 2 does not work. I will put an update here or new post if I will find a simple solution for the 4x4 and bigger cubes.

Tuesday, August 14, 2018

How I built 3D version of fractal – Pythagoras Tree

Once I was reading in Wikipedia different mathematical articles and accidentally opened an article about Fractals and I liked the picture with 2D Pythagoras tree.


Then I wanted to see how it would look like in 3D and search returned me this:


As it is clearly seen, this one is 3D Model made in one of the 3D Editing software. Inspired by this picture I decided to build my own Pythagoras Tree from wooden coffee sticks.

So, I managed to make 3-level tree:
  • First level – One big cube (12 sticks)
  • Second Level – Four cubes which are 1.41 (square root of 2) times smaller (4*12=48 sticks)
  • Third level – 16 small cubes (16*12=192 sticks)
In total 252 sticks were required, which were connected by rubbers. And this is what I got in the end:


I took my time and spent 5 minutes per day, this is why the whole process took around 6 months.

After this, I made 270 photos from different sides and on 3 level. With special software, I managed to make 3D Model out of these 270 pictures. This is the model:

Video with an explanation of the creation process of Pythagoras Tree and result:

Monday, August 13, 2018

Funny Loading/Waiting Icons Based on Scientific Approach

Introduction

One day I was trying to find funny scientific waiting or loading icons, but there were only a few of them, like rotating atom, DNA molecule, rotating earth and other planets. And most of them are just an artist's impression of the scientific object, but not real science. These are examples of standard icons, which almost everyone uses:
      

After spending some time searching for them, I decided to make my own ones, based on real scientific calculation (or almost real :)). And this is what I got.

Gravitational Orbit Precession

These icons were made by using one of the solutions of Einstein field equations in General Relativity. It describes planet orbit precession and first was discovered for Mercury and explanation of this phenomena was one of the first proof of Einstein's General Relativity. Icons are listed below, feel free to reuse it everywhere. I declare it as public domain icons from a copyright point of view because they were created by me :)
Loading icon in black color based on Planet Orbit Precession calculated from Einstein General Relativity Loading icon in blue color based on Planet Orbit Precession calculated from Einstein General Relativity Loading icon in dark pink color based on Planet Orbit Precession calculated from Einstein General Relativity
Loading icon in green color based on Planet Orbit Precession calculated from Einstein General Relativity Loading icon in pink color based on Planet Orbit Precession calculated from Einstein General Relativity Loading icon in red color based on Planet Orbit Precession calculated from Einstein General Relativity
Loading icon in sea green dark color based on Planet Orbit Precession calculated from Einstein General Relativity Loading icon in sea green light color based on Planet Orbit Precession calculated from Einstein General Relativity Loading icon in light blue color based on Planet Orbit Precession calculated from Einstein General Relativity

Lissajous curve

Lissajous curve is more mathematical abstraction but occurs often in physics when 2 sin-wave form signals are analyzed and compared with an oscilloscope. I still remeber labs about them with oscilloscope in my University. Mathematically it is very similar to a circle, but with just different phases, frequencies and amplitudes by x and y axes. As previous icons, I declare them as public domain icons from a copyright point of view and everyone can use them :)

Waiting icon in black color based on Lissajous curve Waiting icon in blue color based on Lissajous curve Waiting icon in black/red/green/blue colors based on Lissajous curve
Waiting icon in dark pink color based on Lissajous curve Waiting icon in green color based on Lissajous curve Waiting icon in pink color based on Lissajous curve

Waiting icon in red color based on Lissajous curve Waiting icon in dark sea green color based on Lissajous curve Waiting icon in sea green color based on Lissajous curve

Waiting icon in light blue color based on Lissajous curve Waiting icon in rainbow colors based on Lissajous curve

All the icons can be downloaded in 1 zip archive here.